

Case study · Inner Dimension Yoga
Best year in five.
The system behind it, built with one of YouTube's biggest yoga channels.
Fourteen months working with the Inner Dimension Yoga team: a repeatable publishing system, a back library brought back to life, and a public channel built to lead viewers to the paid program.
The 30-second version
11.16M
views in 2024, the channel's best year in five
5.2M+
views from 51 new videos, still climbing
20
of those launches passed 100,000 views
21,597
average first-week views for new videos, above the previous record of 19,600
Who this approach suits: brands with a video library and a paid product, such as memberships, courses, apps, or programs.
Where the channel stood in early 2024:
- No shared process. Topic choice, production, editing, design, and publishing were decided video by video.
- An aging back catalog. Years of videos sat past their traffic peak.
- No line between free and paid. Premium cinematic classes, the kind members pay for, were also published free on YouTube.
The talent was already there. Travis Eliot had built a devoted worldwide community of students and a subscription platform around his teaching. What was missing was a repeatable system. This is the story of the Inner Dimension and InSol360 teams building one together.
Part 1
We built the system
We did not start by making new videos. We started by replacing guesswork with a working rhythm. Four changes, rolled out over the first months:
- Data picks the topics. Every video begins with what people already search for, not what feels right that week.
- Work ships in batches. Production, editing, design, and publishing became one repeating process: the same steps, the same rhythm, every batch.
- Tests decide what viewers see first. Every thumbnail went into a live test against another version.
- Every video sells, and every result gets counted. One clear call to action to the paid program went into every video on the channel, long form and short form, each on a tracked link, so the team could measure the trials and paying members coming from YouTube.
See the proof
- The regular workload: 20 video optimizations, 20 custom thumbnails, 20 thumbnail tests, and 20 shorts, with weekly team meetings.
- We researched 1,562 search phrases to choose topics and titles.
- Drag the handle to compare a real test:
This test lifted the click rate from 5.83 to 7.77 percent, with 99.74 percent statistical certainty. The winner went live the same week (TubeBuddy, Aug 2024).
- The full split-test result page for the same test:
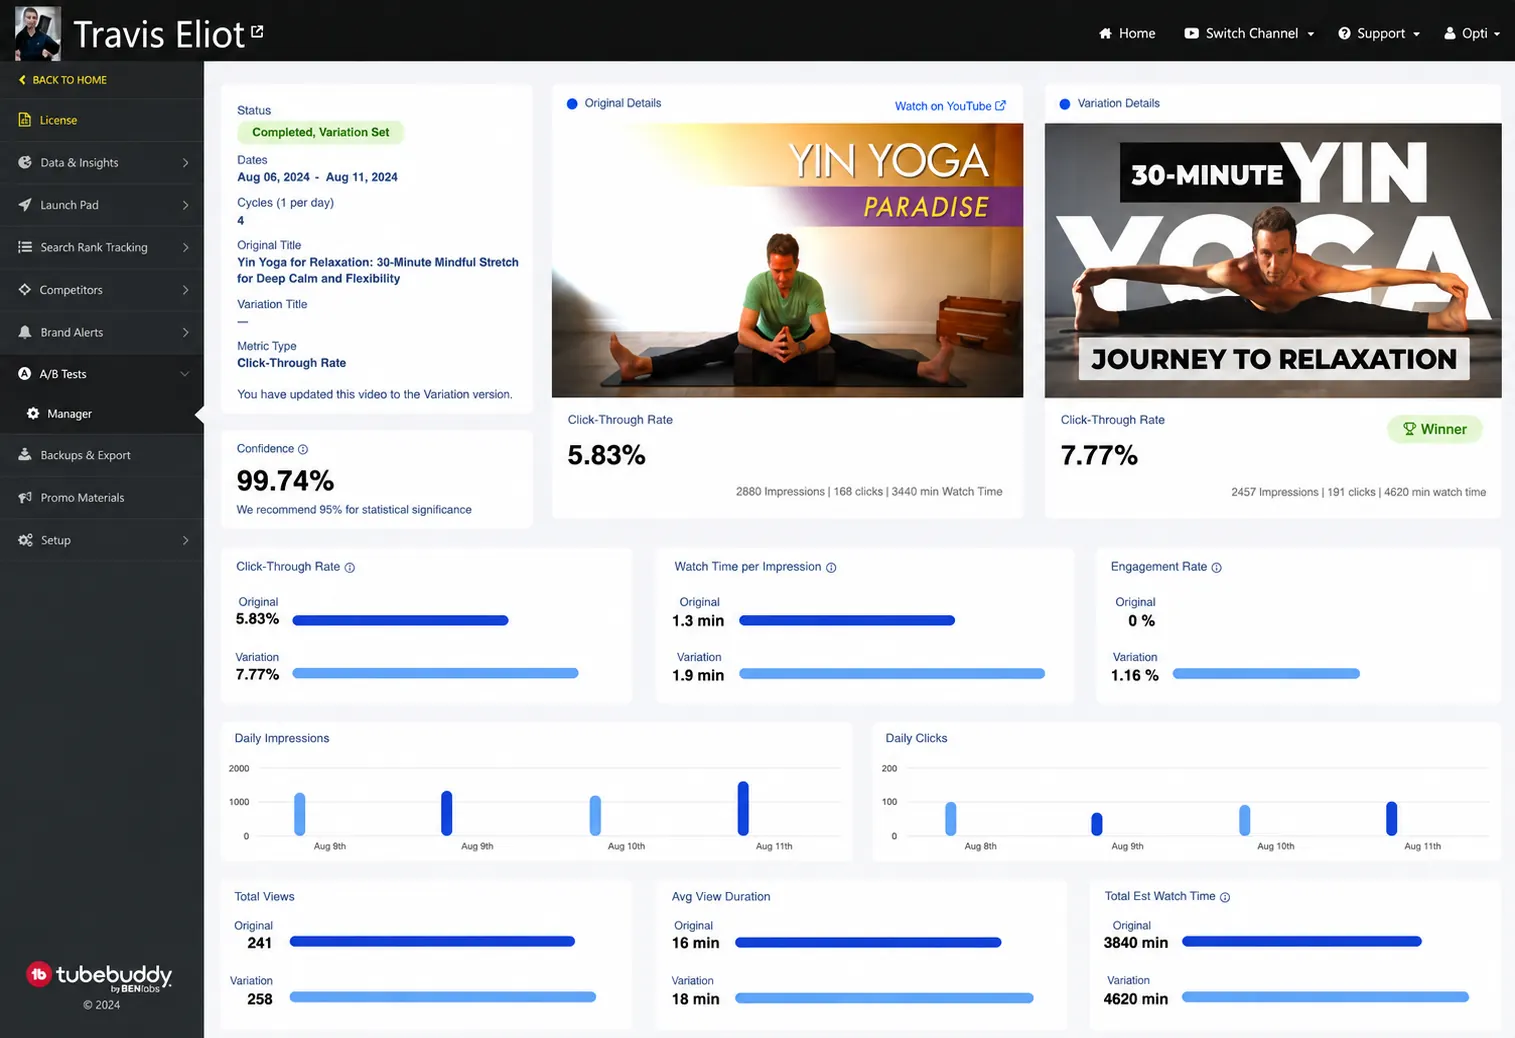
The certainty score, watch time, and daily impressions and clicks, side by side (TubeBuddy).
- Measurement note: one subscription call to action on a tracked link sits in every video on the channel, long form and short form.
Part 2
We brought the old videos back to life
Best year in 5
for views, on an aging channel
×10
search traffic on one reworked video
9.0%
click rate from search on this video, against 7.7% for search across the channel
The channel's long-form library held roughly 170 videos: years of good work, slowly going quiet. So we reworked nearly every one of them, batch after batch: new titles, new descriptions, new tags, tested thumbnails.
What changed:
- Best year for views in five years. Up 8.9 percent on 2023, on a mature library.
- And it came while recommendation traffic fell. Search, the channel's largest source, kept growing: people typing what they want and finding these videos.
One example shows the pattern clearly. Power Yoga for Muscle Building is a 30-minute strength practice that had sat on the channel for years, its traffic flat. After we reworked it in March 2024, its search traffic grew about ten times while every other source stayed flat. The growth appeared in search, the one source the rework was built for.
See the proof
- Best year detail: 11.16M views in 2024, up 8.9 percent over 2023 (YouTube Studio).
- The click rate (the share of people who click after seeing a thumbnail) rose from 3.8 to 4.2 percent, the biggest one-year jump in five years of data, while the number of thumbnails shown stayed high.
- The algorithm contrast: browse recommendations fell 9.2 percent, from 2.2M views in 2023 to 2.0M in 2024. Suggested fell 7.1 percent, 1.7M to 1.5M. Search rose 3.5 percent, 2.6M to 2.7M. The record year came while both recommendation sources declined.
- Traffic sources for Power Yoga for Muscle Building:
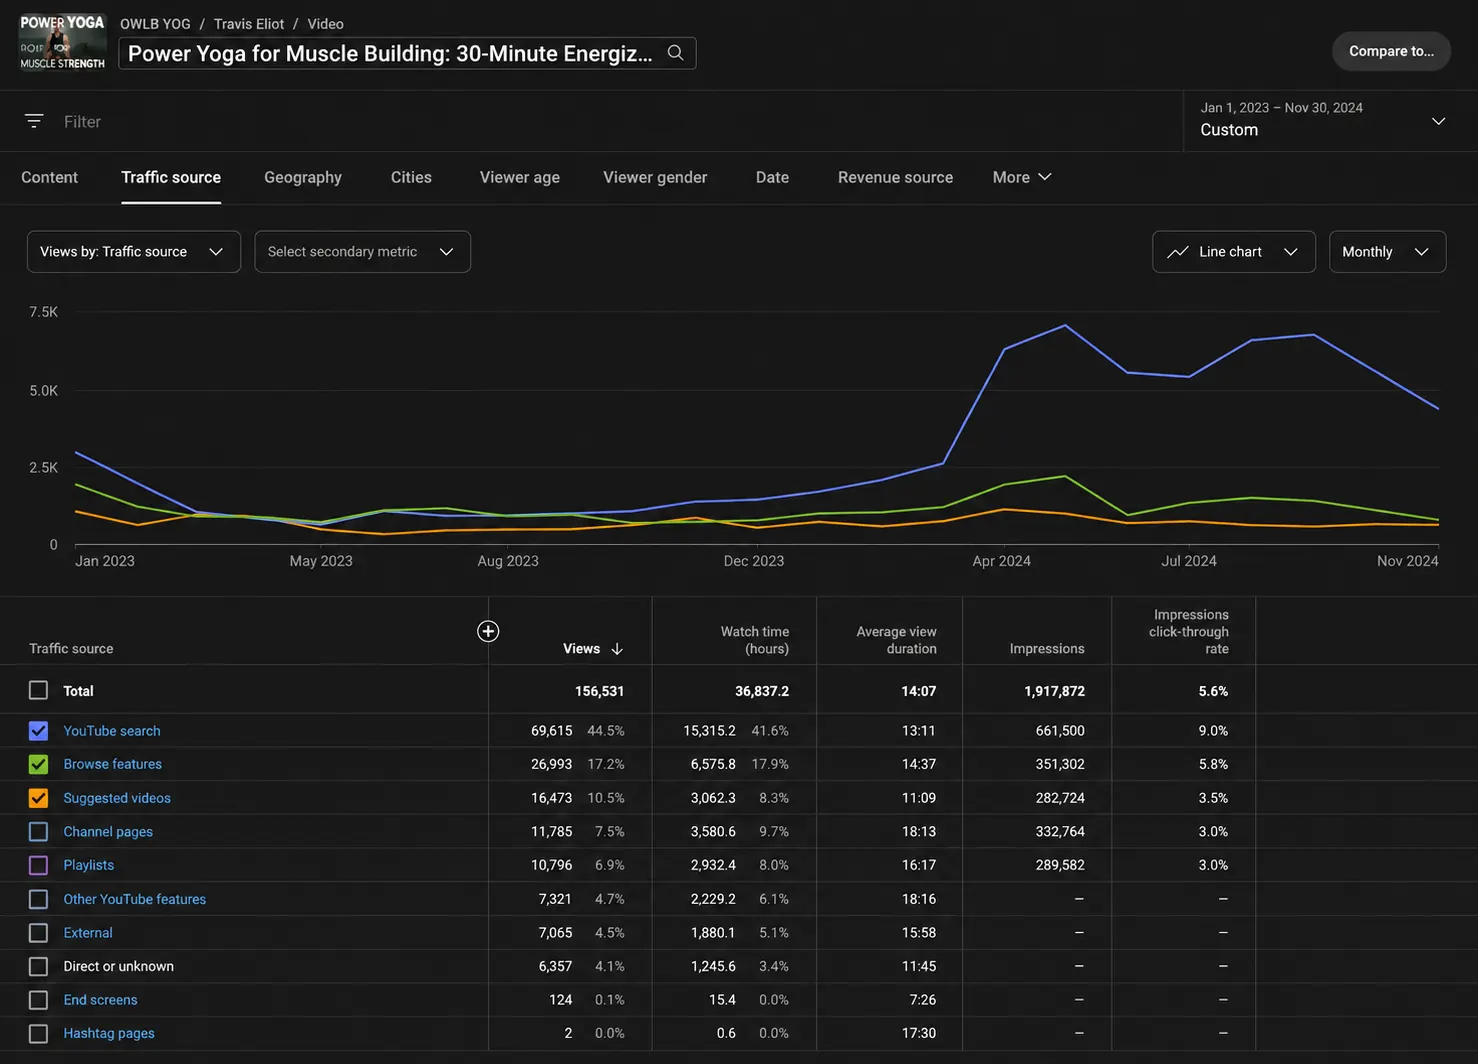
Search grew to roughly ten times its old level after the March 2024 rework, while every other traffic source stayed flat. Search delivered 44.5 percent of this video's views at a 9.0 percent click rate (YouTube Studio).
- Second example: Yin Yoga for Upper Body, a four-year-old video, reworked July 2024. Its monthly click rate moved from about 4.7 to 5.8 percent, and views, watch time, and subscribers all turned upward.
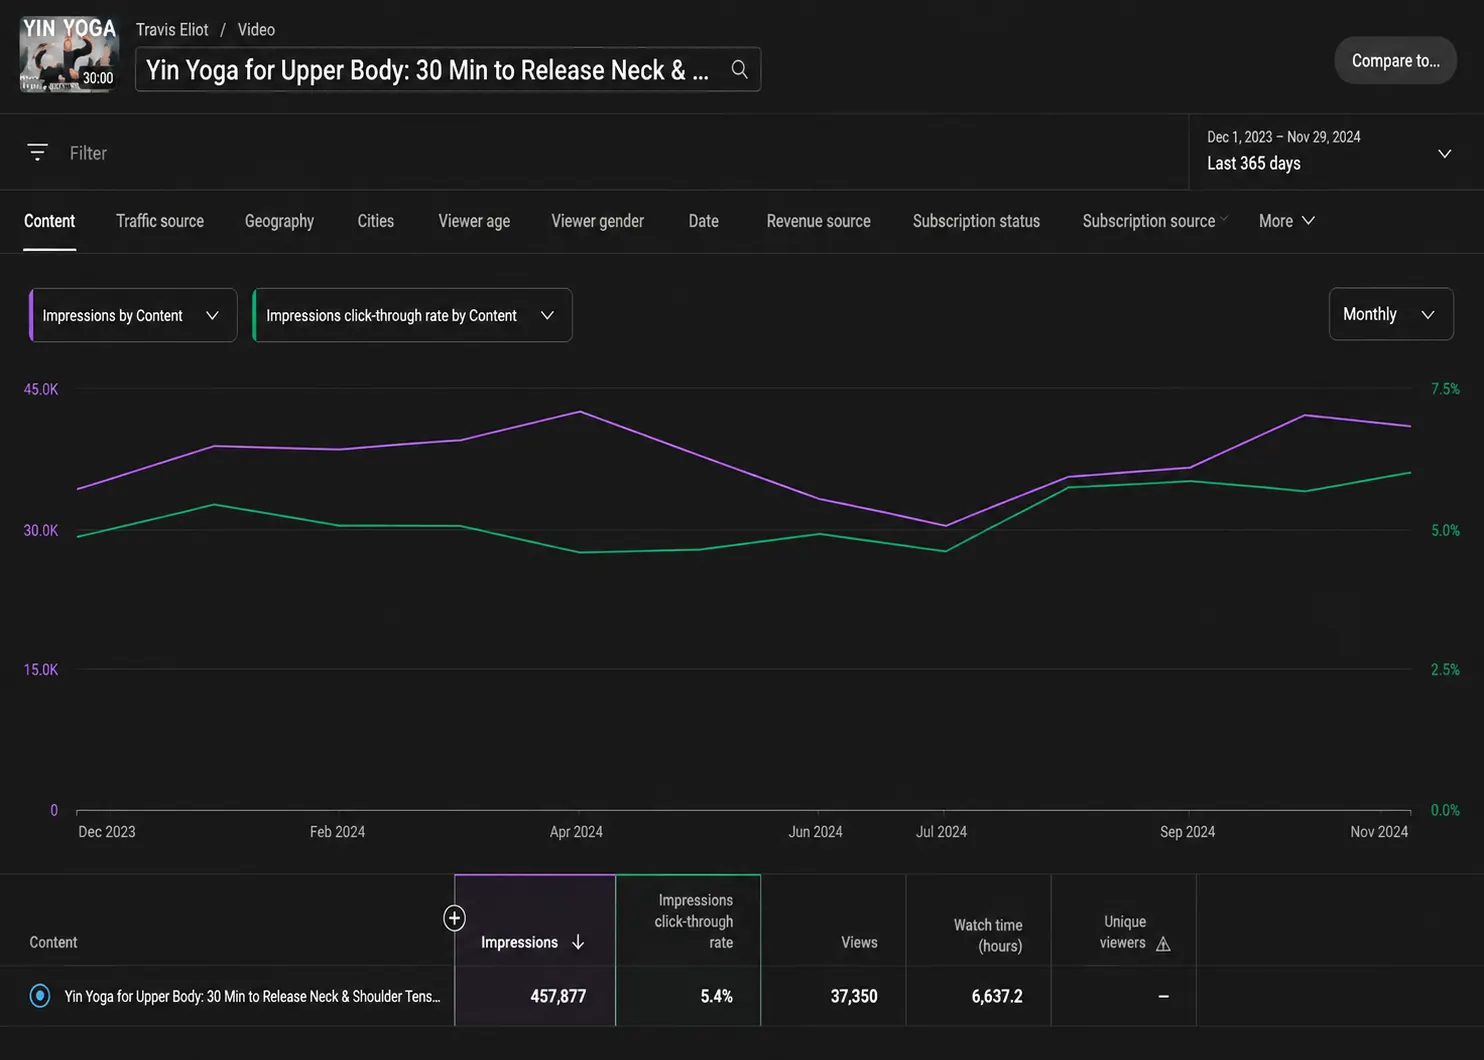
Thumbnail views (impressions) and click rate, last 365 days, with the rework point marked (YouTube Studio, captured Dec 1, 2024).
- Channel level: search is the number one traffic source, and it grew every single year of the period.
Traffic source Share of views Click rate Avg watch per view Share of watch time YouTube search 27.0% 7.7% 19:00 33.0% Browse (recommendations) 21.8% 4.3% 12:47 17.9% Suggested videos 18.0% 2.9% 12:35 14.6% Long-form videos, January 2022 to December 2024 (YouTube Studio). Search viewers click more and watch about 50 percent longer.
- In total: nearly the whole long-form library, reworked across 33 batches.
Part 3
Free and paid, separated
21,597
new first-week average, against an all-time ceiling of 19,600
20
launches past 100,000 views
5.2M+
views from the 51 new videos, July 2026
We proposed a clear line between free and paid, and the Inner Dimension team adopted it and put it into practice. Premium cinematic productions went behind the subscription wall, where the paying members are.
The public channel took the opposite role: simple, lower-cost videos built to be found in search. Each one answers a practice people already search for, and each one carries the same next step: start the free trial of the paid program. Watch free, practice, and when you want more, the door is right there.
What followed:
- Fifty-one new videos launched. Among launches tracked week by week, first-week views averaged 21,597, above the previous record of 19,600.
- Twenty passed 100,000 views, spread across the whole launch program.
The project ended in April 2025. As of July 2026, the new videos we helped launch are still climbing and have passed five million views.
See the proof
- The two-tier approach we proposed, adopted by the Inner Dimension team:
Premium videos
Cinematic productions, filmed with a crew. The paid product, made to be worth paying for.
Home: behind the subscription wall
Optimum videos
One or two cameras, tight editing, 8 to 30 minutes. Built to be found by people searching.
Home: public on YouTube, feeding the paid program
- Launch detail: first-week average 21,597 against the all-time ceiling of 19,600; late launches reached 51K to 78K first-week views.
- 20 of the 51 launches have crossed 100,000 views; program total 5.2M+ views (public view counts, July 2026).
Every launch in the program at its public view count, July 2026: about 5.27 million views total, averaging roughly 103K per video. Anyone can verify these numbers on the public channel.
The fourteen months at a glance
MAR 2024
First batch of reworked videos goes live, Power Yoga for Muscle Building among them.
APR 2024
First new video, chosen by search data, goes live.
JUN 2024
Tracked subscription links live in every video.
AUG 2024
Thumbnail testing running at full speed.
OCT 2024
Engagement expanded to a second channel.
JAN 2025
Record launches: 51K to 78K first weeks.
APR 2025
Project ends.
JUL 2026
Still growing on its own; five million views and counting.
Where they started, where they ended
March 2024
- Topics and publishing decided video by video
- Premium classes published free on YouTube
- A large library past its traffic peak
- First-week record: 19,600
Fourteen months later
- One repeatable system: data picks topics, batches ship, tests decide
- Premium behind the wall; public videos feeding the paid program
- Best year for views in five years
- New first-week average: 21,597; best launches up to 78,000
- Every video on a tracked link, results measured every month
Find out what is holding your channel back.
A thirty-minute call. We look at your channel together, and you leave with the three changes that would move it most, whether we work together or not.
Book a Free Strategy CallAbout the figures
- Inner Dimension reviewed the figures on this page for accuracy. The views and conclusions are InSol360's own.
- All figures are dated and sourced from YouTube Studio, TubeBuddy, vidIQ, and public view counts. No paid promotion behind any video.